ON7MV 40 m 4-Square (2026)
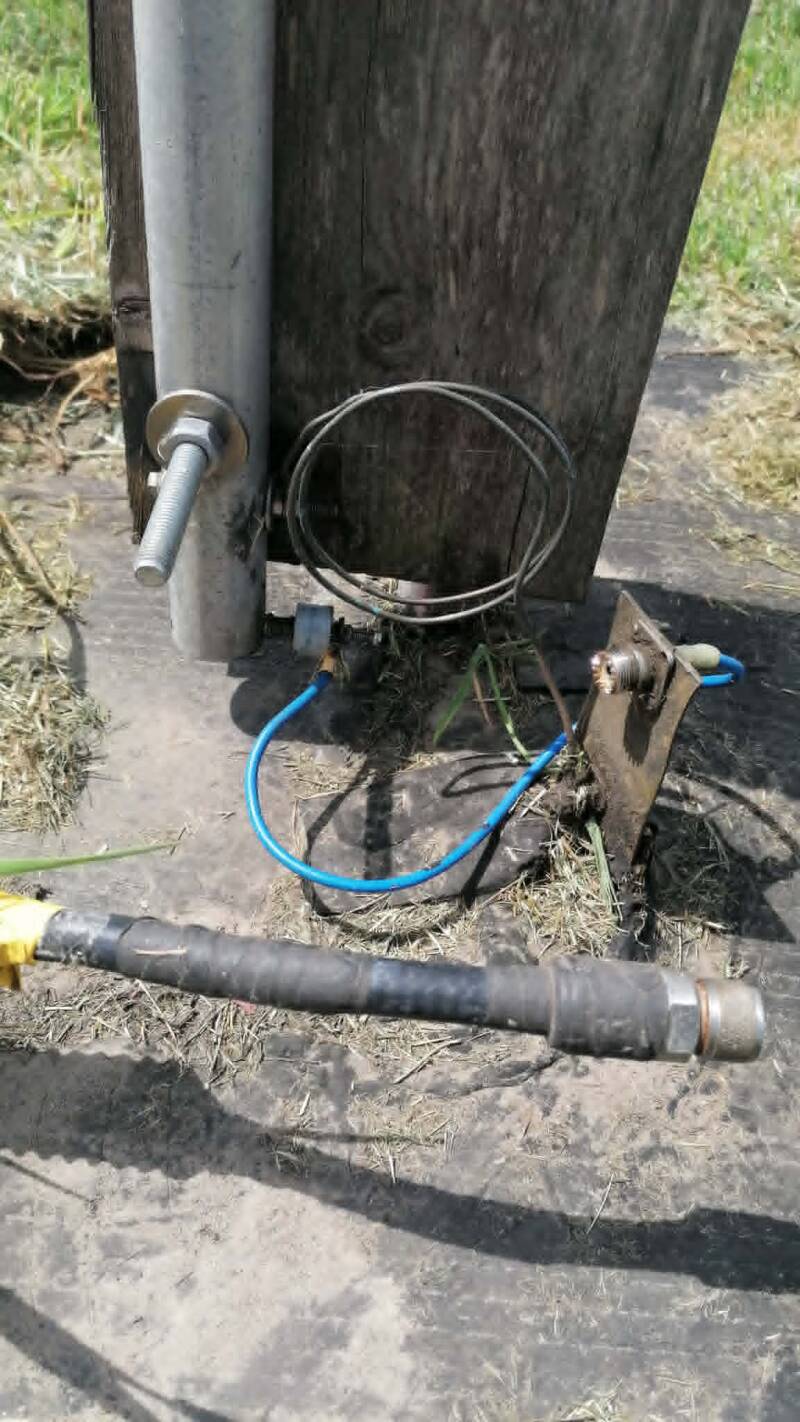
“Each feed point now uses a tuned LC network (coil and capacitor), because the natural feed‑point impedance of my verticals — due to the extensive radial system — is around 36 Ω, which is far too low for the coupler. To solve this mismatch, I implemented a resonant matching circuit at each antenna base. Because all of these changes affected the electrical behaviour of the system, I had to retune the verticals from scratch. We used this opportunity to document every step of the process in a structured and repeatable way.”
Contents and measurement sequence
- Purpose and scope
- System description and design references
- Measurement philosophy and data hierarchy
- Initial condition and reason for retuning
- Individual radiator measurements at the feedpoints
- Quarter-wave transformation and matching logic
- Box-input VNA measurements in the eight directions
- Dummy-load measurements across the 40 m band
- Interpretation of the two switching-mode families
- Power scaling and dummy-load implications
- On-air directional verification
- What the complete campaign proved
- Remaining limitations and recommended follow-up
- Final technical conclusion
- Appendices: raw accepted tables, calculations and references
1. Purpose and scope
The purpose of this report is to document the complete measurement and retuning campaign performed on the ON7MV 40 m RemoteQTH 4SQ-8DIR array. The report explains why each measurement was made, what part of the system it tested, what changed during the work and what can reasonably be concluded from the final results.
The campaign did not rely on a single SWR reading. A four-square is a phased system in which individual radiator impedance, quarter-wave transformation, mutual coupling, hybrid balance, dummy-load power and the selected phase state all interact. The measurements were therefore performed in layers: first at the individual radiator feedpoints, then at the coupler input, then through the dump-load system and finally by on-air directional comparison.
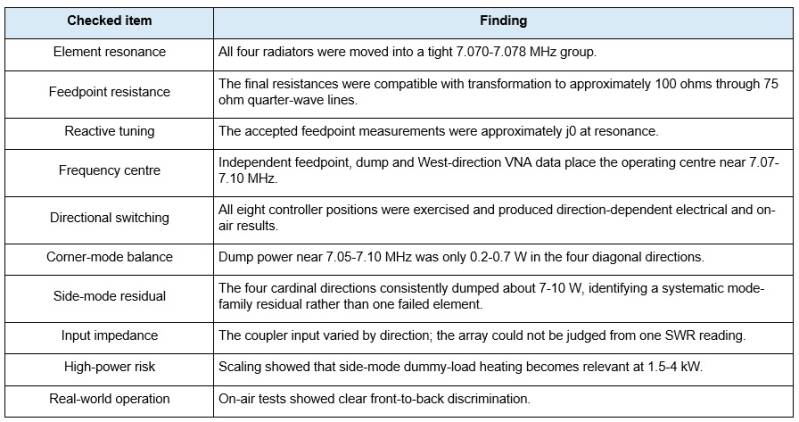
- Verify that all four radiators were resonant in the intended 40 m operating region.
- Bring the feedpoint resistances close to the value required by the 75 ohm quarter-wave transformer strategy.
- Check the completed array in every selectable direction, not only in one preferred direction.
- Use dump-load power as an indicator of system imbalance and lost transmitter power.
- Determine the practical operating centre and bandwidth of the complete installation.
- Confirm that the controller and eight-direction switching produced real directional discrimination on air.
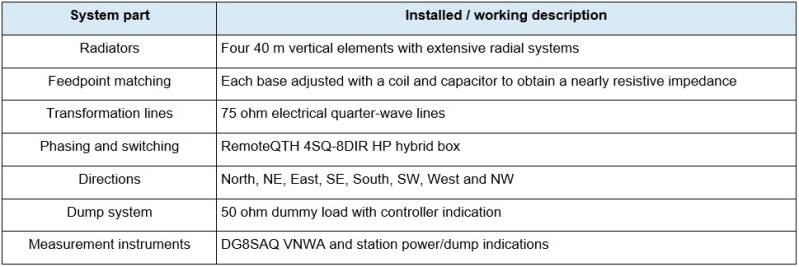
2. System description and design references
The installation uses four vertical radiators in a square geometry, a RemoteQTH 4SQ-8DIR HP hybrid/phasing box and a controller providing eight beam headings spaced by 45 degrees. The four diagonal or corner headings use the conventional four-square current relationship, while the four side headings use a different two-front/two-rear current distribution. This distinction is important when interpreting the dump-power results.
The manufacturer describes the system as an eight-direction phased vertical array based on the K3LC concept. The published RemoteQTH information specifies a 100 ohm design environment, element feedpoints around 50 ohms and optional 75 ohm feeding lines. The DF6QV four-square reference further explains the quarter-wave transformation to approximately 100 ohms at the centre and states that transformed values from about 90 to 110 ohms are acceptable.
3. Measurement philosophy and data hierarchy
Several measurement stages existed during the project. Some readings were preliminary, some were later corrected, and some were qualitative LED observations before the dump indication was converted into actual watts. To prevent old values from being mistaken for final acceptance data, this report uses the following hierarchy.
- Accepted final feedpoint values are the four user-confirmed measurements at 7.070, 7.078, 7.074 and 7.072 MHz.
- The quantitative 100 W FM dump-power table supersedes the earlier qualitative LED-only observations.
- The later West-direction VNA sweep supersedes the earlier West reading of approximately 52.8 + j3.7 ohms at 7.100 MHz.
- On-air results are treated as practical observations, not laboratory-grade dB measurements, because propagation and S-meter calibration introduce uncertainty.
A low input SWR was never used as the sole proof of array quality. The DF6QV reference explicitly warns that the input SWR of the phasing box can remain low even with open or shorted outputs. Element measurements and dump power are therefore essential.
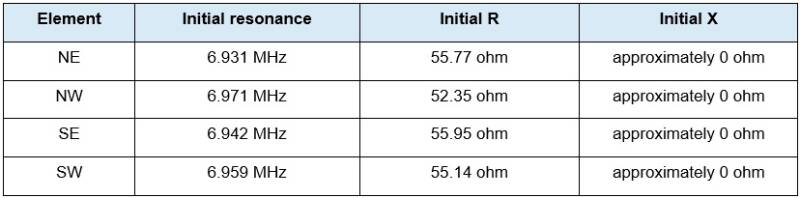
4. Initial condition and reason for retuning
The first feedpoint measurements showed that all four elements were resonant too low in frequency for the desired 40 m operating range. The initial average resonance was approximately 6.951 MHz, with a 40 kHz spread between the lowest and highest elements. The dump indication also changed substantially above 7.0 MHz, confirming that the complete system was not centred where intended.
The radiators were therefore shortened or otherwise adjusted upward in frequency while preserving the feedpoint resistance near the intended value. The matching components at the bases were used to obtain a nearly zero reactance and to keep the resistive component close to the quarter-wave transformation target.
5. Individual radiator measurements at the feedpoints
Each radiator was measured at its base as an individual element. In accordance with good four-square setup practice, the purpose of this test was to establish the element resonance and feedpoint resistance before judging the combined system. Mutual coupling means that the active impedance in the complete array will not be identical to the isolated value, but equal isolated measurements are still the correct starting condition.
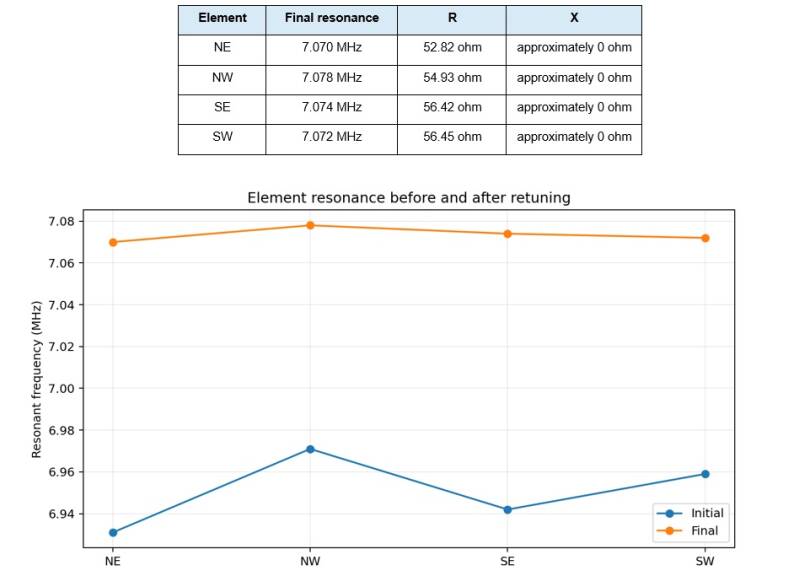
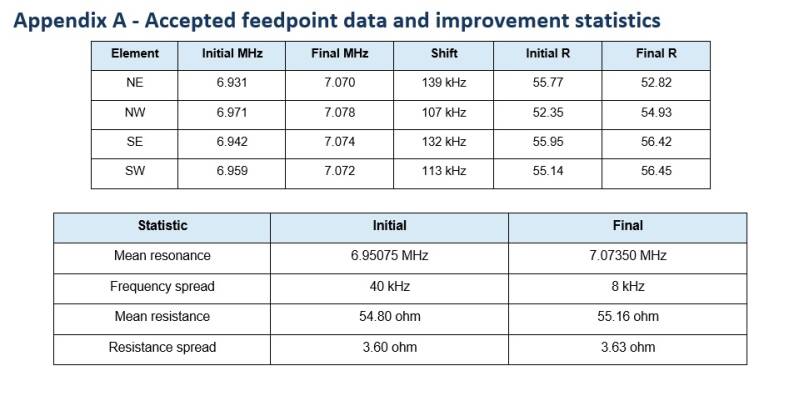
Figure 1 - The retuning moved all four element resonances upward and reduced the frequency spread from 40 kHz to 8 kHz.
The average resonance moved from 6.951 MHz to 7.0735 MHz, an average upward shift of 122.7 kHz. The element-to-element resonance spread was reduced by 80 percent. The final average feedpoint resistance was 55.16 ohms.
Feedpoint conclusion: the four radiators were brought into a very narrow frequency group around 7.074 MHz, with nearly zero reactance and resistances compatible with the 75 ohm quarter-wave transformation method.
6. Quarter-wave transformation and matching logic
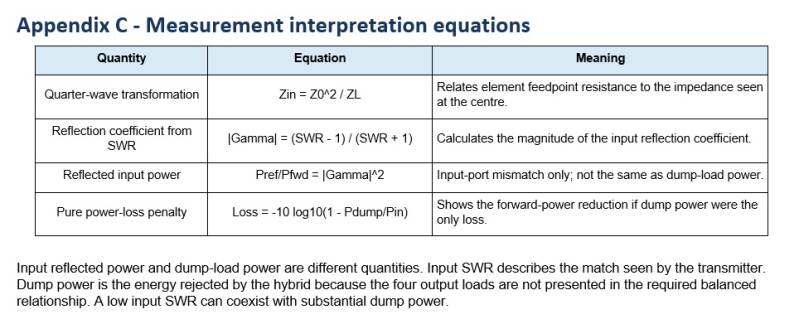
For an ideal lossless quarter-wave transmission line, the impedance transformation is given by:
Zin = Z0^2 / ZL
With a 75 ohm line and a 56.25 ohm load, the transformed resistance is exactly 100 ohms. This is why a feedpoint near 56 ohms was used as the practical target for this installation.
This calculation does not include cable loss, velocity-factor error, connector reactance or mutual coupling. It nevertheless proves that the final isolated feedpoint values were intentionally positioned in the correct range for the transformation lines rather than merely tuned for a visually attractive 50 ohm SWR at the radiator bases.
7. Box-input VNA measurements in the eight directions
After the individual elements and feed lines were connected, the array was measured at the input of the 4SQ box in each selected direction. This test included the combined effect of the four radiators, mutual coupling, transformation lines, switching relays and the hybrid network.
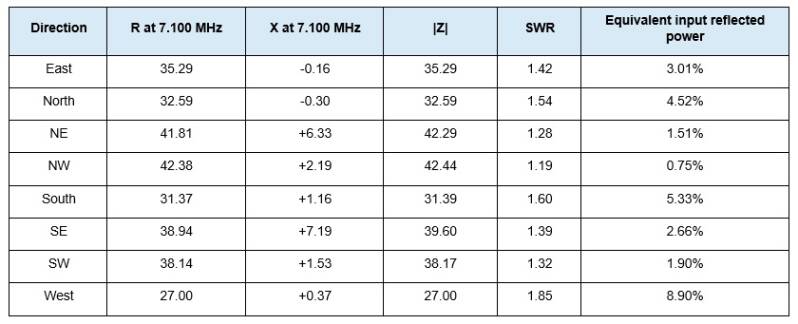
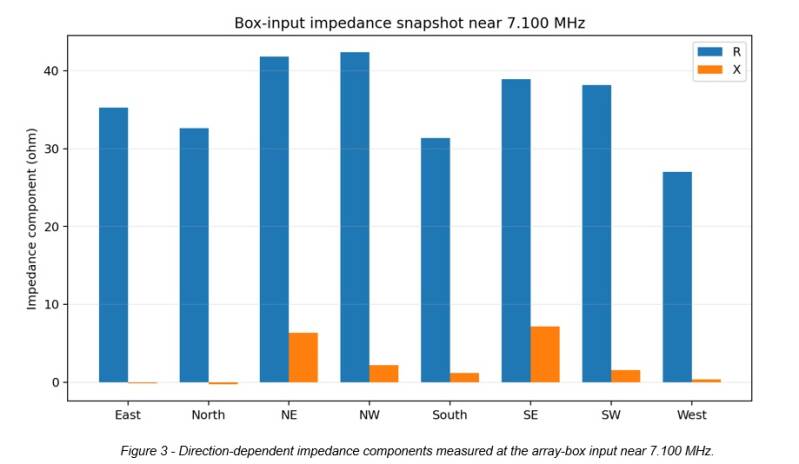
The eight controller positions did not present identical input impedances. The best SWR in this snapshot was 1.19 in the NW direction, while the highest was 1.85 in the West direction. This variation confirms that the two switching-mode families and the real coupled element impedances do not produce a perfectly invariant 50 ohm input.
The values must not be interpreted as eight independent antenna resonances. They are the total input response of the complete phased network. In particular, the low input resistance measured in several positions does not by itself identify which component is responsible. Dump power, individual feedpoint measurements and on-air directivity are needed to complete the diagnosis
8. Later West-direction verification after retuning
A later West-direction sweep was retained as the final West verification. It replaced an earlier same-day reading of approximately 52.8 + j3.7 ohms and SWR 1.09 at 7.100 MHz. The large difference between the two readings shows why repeated measurements, stable relay selection and a fixed calibration plane were essential.
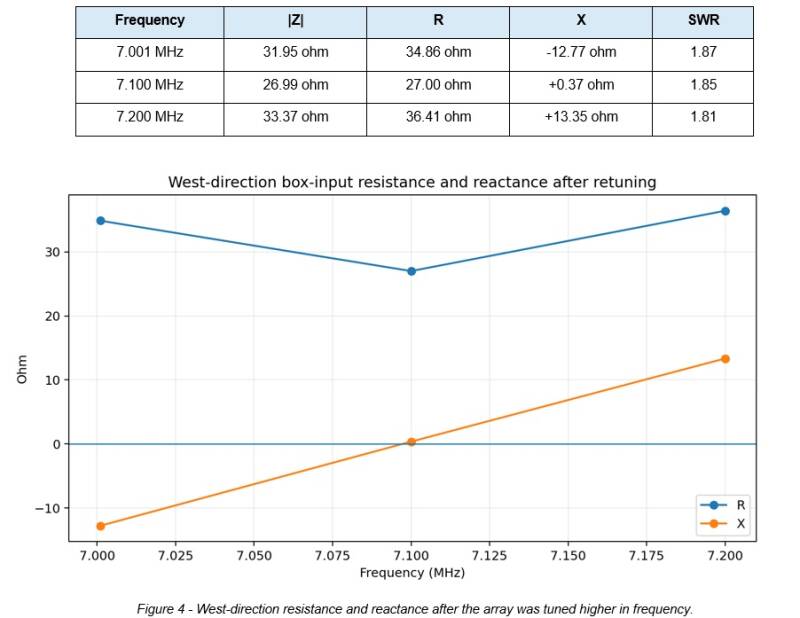
The reactance changes from capacitive at 7.001 MHz to almost zero at 7.100 MHz and inductive at 7.200 MHz. The zero crossing therefore places the electrical centre of this direction close to 7.10 MHz. The resistive component remains below 50 ohms, explaining why the SWR stays around 1.8 rather than reaching 1.0.
9. Dummy-load measurements across the 40 m band
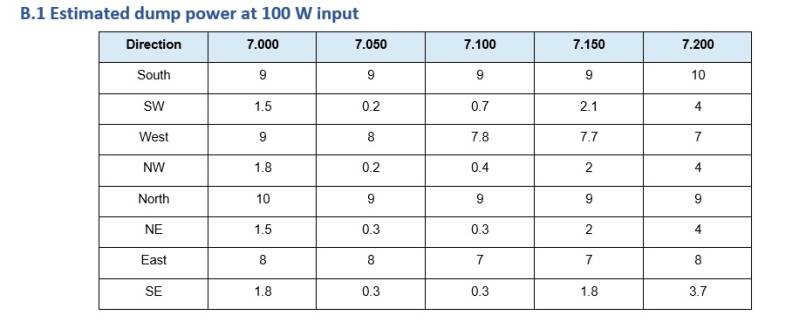
The dump-load test was performed with approximately 100 W FM at 7.000, 7.050, 7.100, 7.150 and 7.200 MHz in all eight directions. Because the transmitter power was 100 W, the numerical dump value in watts is also the percentage of input power delivered to the dummy load.
The final watt table below supersedes earlier qualitative LED observations. The user clarified that the LED bar must not be interpreted as one LED equalling 10 W; ten LEDs corresponded to the 100 W reference condition.
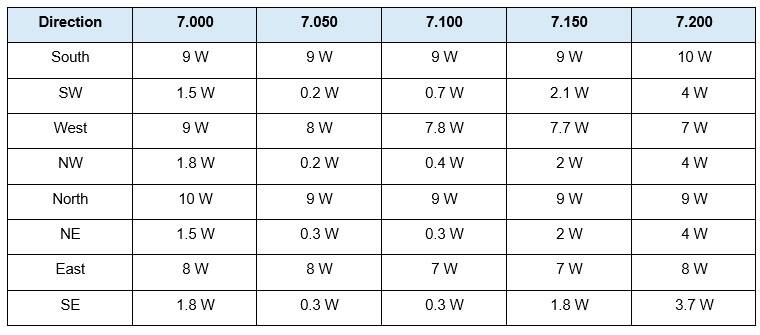
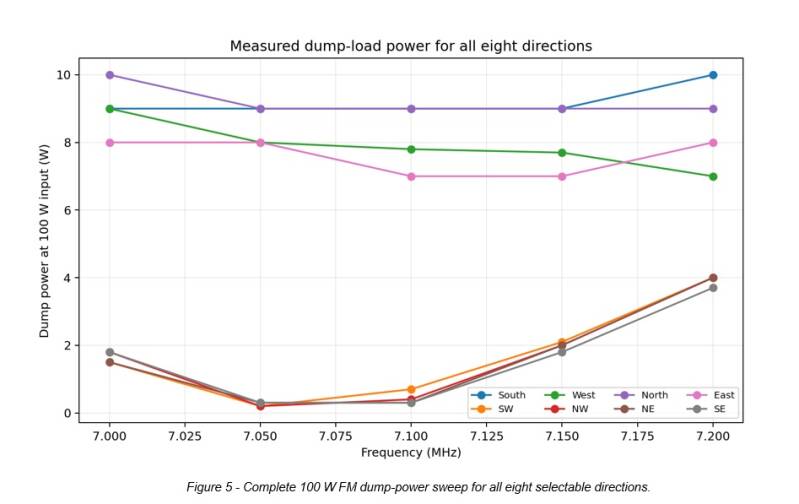
10. Interpretation of the two switching-mode families
The data separates naturally into two groups. The four corner directions NE, NW, SE and SW show very low dump power near the centre of the band. The four side directions North, East, South and West show a much higher and relatively flat dump level.
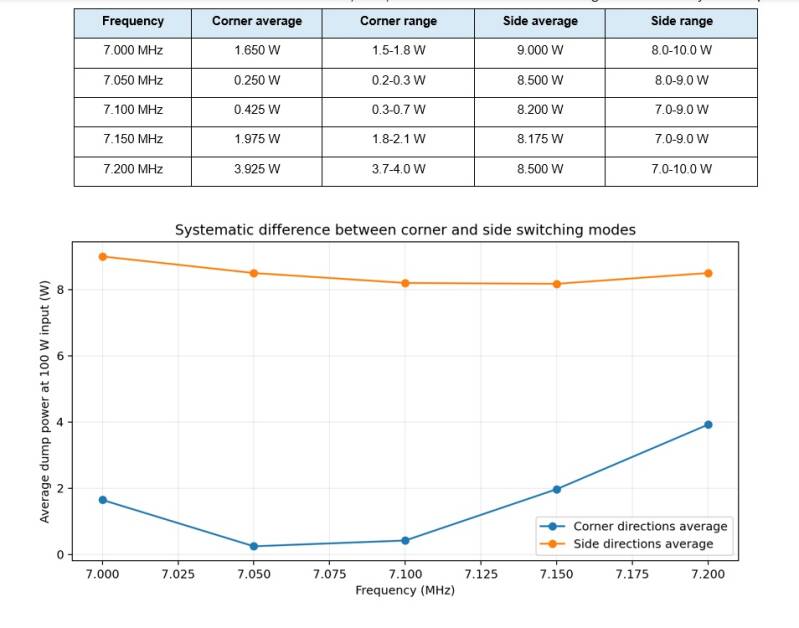
Average dump power of the corner and side direction groups.
The corner-mode minimum occurs around 7.050 to 7.100 MHz, where the average dumped power is only 0.25 to 0.425 W. This is 0.25 to 0.425 percent of the transmitter power and represents negligible pure power loss.
The side-mode average remains approximately 8.2 to 9.0 W across the same test range. The similarity of North, East, South and West is important: it argues against one failed radiator or one isolated relay fault. The more likely interpretation is a systematic difference in the side-mode current distribution, transformed impedances or hybrid balance under the actual coupled element loads.
A 7 to 10 percent dump fraction corresponds to a pure transmitter-power of only about 0.32 to 0.46 dB. However, dump power is also evidence of amplitude or phase imbalance, and that imbalance can affect front-to-back performance more than the small forward-power loss alone would suggest.
The dump measurements show an exceptionally well-balanced corner mode and a repeatable, systematic residual loss in the four side modes. This is a mode-family characteristic of the installed system, not an isolated direction failure.
11. Frequency centring and usable bandwidth
The final element resonances cluster around 7.074 MHz. The corner-mode dump minimum lies around 7.050 to 7.100 MHz. The later West reactance crosses zero close to 7.100 MHz. These independent observations place the practical electrical centre of the installation in the lower-to-middle part of the 40 m band, close to 7.07-7.10 MHz.
- At 7.000 MHz the corner-direction dump is already low, averaging 1.65 W.
- At 7.050 MHz the corner-direction average reaches its minimum of 0.25 W.
- At 7.100 MHz the corner directions remain excellent at 0.3-0.7 W.
- Above 7.150 MHz the corner-mode dump rises, reaching approximately 3.7-4 W at 7.200 MHz.
- The side directions remain relatively flat, so their behaviour is not primarily a narrow-band resonance problem.
12. Power scaling and dummy-load implications
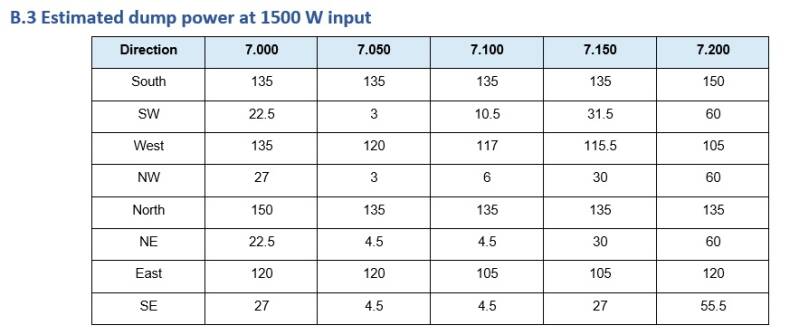
The 100 W readings can be linearly scaled as a first-order estimate, provided the hybrid, relays, feed lines and dummy load remain linear and the transmitter duty cycle is considered. The scaling does not replace a thermal rating analysis.
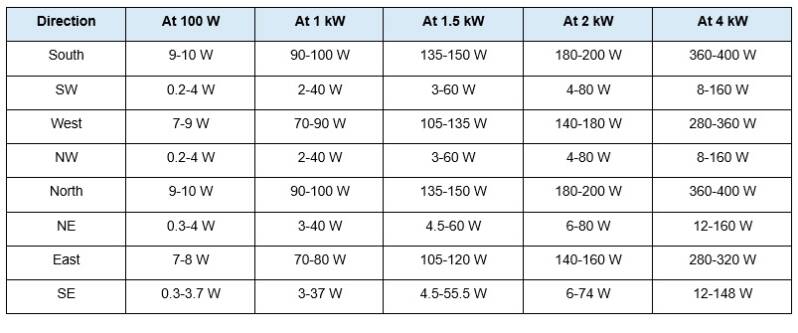
At the legal 1.5 kW level, the measured side-mode fractions predict approximately 105 to 150 W in the dummy load. The best corner settings predict only a few watts near the tuning centre. At 4 kW, the side-mode extrapolation reaches approximately 280 to 400 W, which is significant even when the dummy load itself has a high continuous rating.
The practical conclusion is that dummy-load thermal capacity should be selected for the worst sustained operating mode, not for the attractive minimum observed in the corner directions. SSB contest duty cycle reduces average heating compared with continuous FM, but it does not remove the need for thermal margin.
13. On-air directional verification
After the electrical retuning, on-air comparisons showed approximately four to five S-points of front-to-back difference, depending on the station, direction, propagation and QSB. This was the final practical confirmation that the selected directions were not merely changing the input impedance: they were changing the received field pattern.
The S-point observations are intentionally not converted into an exact dB figure. Real transceiver S-meters are not guaranteed to follow 6 dB per S-unit over the relevant range, and ionospheric fading can easily change the apparent front-to-back ratio during a comparison. The on-air result is therefore qualitative but still valuable.
- Correct controller direction changes were observed.
- Forward and reverse directions produced clearly different received levels.
- The measured electrical centre and low dump in the corner modes were consistent with usable on-air directivity.
- European QSB and limited test geometry prevented a laboratory-grade azimuth pattern measurement.
14. What the complete campaign proved
15. What the measurements did not prove
The campaign was extensive, but the following limitations remain important when interpreting the results.
- No direct current-amplitude and phase measurement was made at all four radiator feedpoints while the array was transmitting.
- The exact electrical length and phase equality of all four installed 75 ohm lines were not documented here as a separate VNA table.
- The internal eight-direction hybrid outputs were not independently characterized with four precision 100 ohm loads in this measurement record.
- The complete azimuth pattern was not measured with a calibrated far-field test range.
- The per-direction input table at every recorded frequency is preserved in the user’s earlier workbook, but only the confirmed 7.100 MHz snapshot and the final West sweep are reproduced here.
- S-meter front-to-back observations cannot replace a calibrated field-strength survey.
16. Recommended follow-up measurements
The current system is operational and directionally effective. The following tests would provide the most useful additional information if further optimization is desired.
- Measure the electrical phase and insertion loss of all four 75 ohm feed lines with the DG8SAQ or FSH8 at 7.0, 7.1 and 7.2 MHz.
- Terminate the coupler with four precision 100 ohm loads and verify amplitude, 90/180 degree phase relationships and dump isolation in all switching states.
- Repeat the 100 W dump sweep after every major mechanical change to ensure that an improvement in one mode does not degrade another.
- Perform a ground-wave field-strength test from several kilometres away and record all eight headings under stable conditions.
- Record dummy-load temperature during a realistic high-power contest duty cycle, especially in the side directions.
17. Final technical conclusion
The ON7MV 40 m RemoteQTH 4SQ-8DIR measurement campaign was successful. The four verticals were initially resonant too low and were retuned into a narrow 8 kHz group centred around 7.074 MHz. Their final resistances and near-zero reactances were consistent with the intended 75 ohm quarter-wave transformation to approximately 100 ohms at the phasing box.
The complete-system measurements demonstrated that the array behaves differently in its two switching-mode families. The four corner directions are exceptionally well balanced near 7.05-7.10 MHz, with only a few tenths of a watt dumped at 100 W. The four side directions show a repeatable 7-10 W residual across the band. Because all four side directions behave similarly, this is best interpreted as a systematic property of the installed side-mode phasing and real coupled impedances, not as a single defective element.
The array input SWR remained usable in all tested directions, but the campaign also confirmed why SWR alone is an inadequate acceptance test for a four-square. Dump power, individual element measurements and real directional response supplied the decisive information.
On-air comparisons showed clear directional discrimination of approximately four to five S-points. Taken together, the measurements prove that the system is tuned, functional and usable for contest and DX operation. Further work should focus on documenting line phase equality and the internal side-mode hybrid balance rather than making arbitrary additional changes to the already well-matched radiator resonances.
FINAL STATUS: The 40 m 4SQ-8DIR array is technically validated and operational. The radiator tuning is complete. The principal remaining optimization target, if pursued, is the systematic dummy-load power in the four side directions.
Appendix D - References
- RemoteQTH, “4SQ-8DIR antenna system.” RemoteQTH product and design page
- Franz Langner, DF6QV, “4-Square Antenna,” sections on system impedance, dumped power, setup notes and the 40 m field test. PDF reference
- ON7MV measurement record, June 2026: element feedpoint measurements, array-box VNA measurements, 100 W FM dump sweep and on-air comparisons.
Create Your Own Website With JouwWeb