ON7MV 80m Two-Element Vertical Array
1. Executive Summary
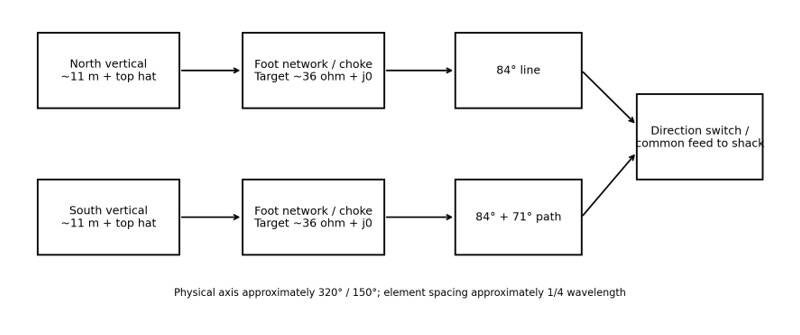
This report documents the complete troubleshooting and optimisation process of a self-built two-element 80 m vertical array using the Christman feed method. The system uses two approximately 11 m vertical sections with capacitive top hats, spaced approximately one quarter wavelength apart, and fed through two 84° coaxial lines with an additional 71° line in the delayed branch.
The investigation included coaxial-line phase verification, individual element impedance measurements, open/short mutual-coupling tests, hairpin matching trials at several target impedances, complete-array measurements in both North and South directions, and repeated fine adjustment of top-hat tension.
Key final result: the two elements were brought to approximately 21–22 Ω + j0 at nearly the same frequency. In the complete Christman system, on the 3.790 switch position, the shack-end impedance improved to approximately 38 Ω with SWR around 1.3–1.4 in both directions, while useful front-to-back performance remained present.
The most important lesson was that a low SWR does not prove correct phasing, and excellent front-to-back does not automatically produce a convenient 50 Ω feed-point impedance. Element equality, mutual coupling, coaxial-line transformation and the total Christman network must be evaluated separately.
2. System Description
- Two self-built 80 m verticals, designated North and South.
- Approximately 11 m vertical section per element with a capacitive top hat.
- Element spacing approximately ¼ λ, about 20 m.
- Array axis approximately 320° / 150°, intended mainly for USA/NW and the opposite SE direction.
- Christman feed: two nominal 84° lines plus one nominal 71° additional line.
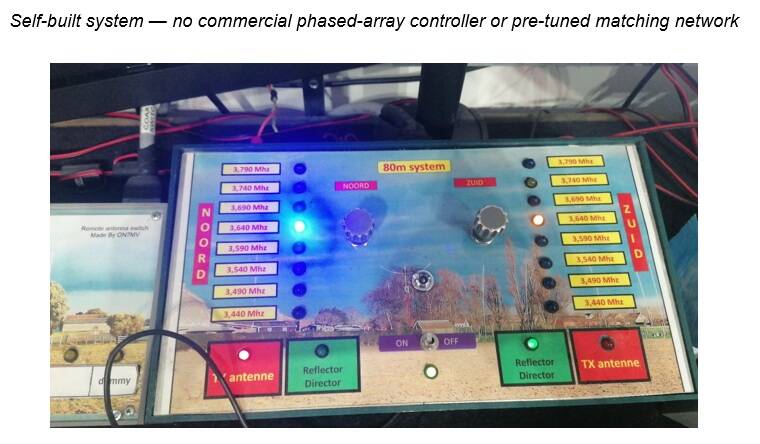
- Direction switching between North and South from the shack.
- Multiple frequency switch positions: 3.790, 3.740, 3.690, 3.640, 3.590, 3.540 and 3.490 MHz.
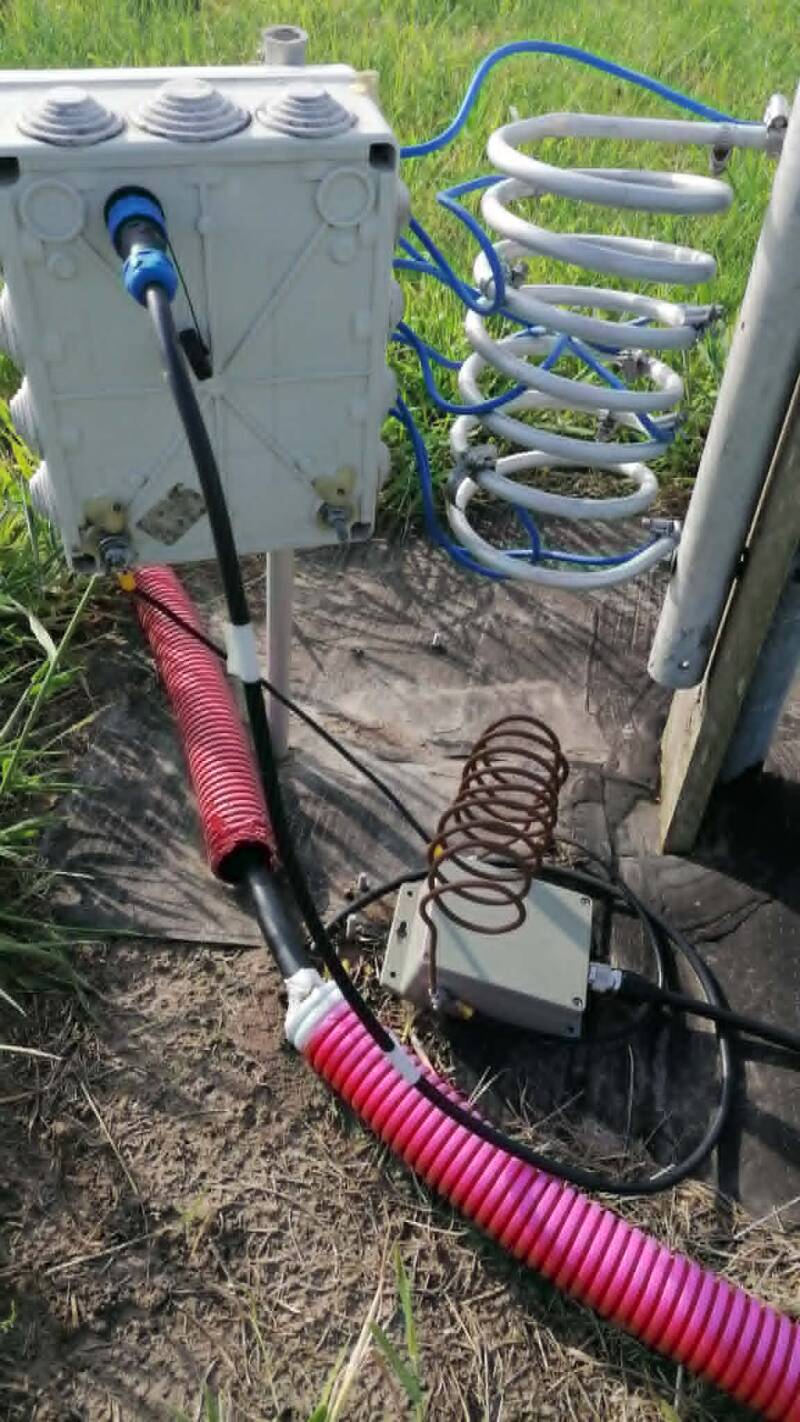
- Common-mode chokes at both element feed points; an additional CMF5000 was also tested at the common feed.
- Measurements performed with a DG8SAQ VNWA V2 and Rohde & Schwarz RTC1002 oscilloscope.
- High-power operational requirement: contest use
Array architecture and design intent
3. Mechanical Tuning Sensitivity
The top hats are tensioned mechanically. Resonance is fine-tuned mainly by slightly increasing or decreasing top-hat tension rather than by cutting wire. In this installation, an effective change of approximately 1 cm corresponds to roughly 15 kHz of resonant-frequency movement.
Wind is therefore a real measurement variable. Small top-hat movement can shift the measured resonance by several kilohertz. Final equality should be judged over repeated measurements and under comparable wind conditions.
4. Measurement Campaign and Number of Measurements
The work was not based on one or two spot checks. More than fifty individual analyzer and oscilloscope observations were made during the investigation. These included repeated measurements after every relevant mechanical or electrical change.
- Individual North element, South open.
- Individual North element, South short-circuited.
- Individual South element, North open.
- Individual South element, North short-circuited.
- Measurements directly at the element feed point.
- Measurements after the 84° coaxial line.
- Complete Christman system in North direction.
- Complete Christman system in South direction.
- All seven switch positions, both directions: 14 complete array states.
- Hairpin removed, hairpin adjusted to approximately 50 Ω, 36 Ω and finally approximately 22 Ω.
- Repeated top-hat tension corrections and rechecks.
- Coaxial phase verification with both VNWA and RTC1002.
5. Verification of the Christman Coaxial Lines
The first 84° line was used as the zero-phase calibration reference on the VNWA. With an additional 84° line and the 71° line inserted, the measured result was approximately 155° near the intended frequency. This is consistent with the expected 84° + 71° total for the longer Christman path.
- The two 84° lines were treated as fixed and were not considered the main fault.
- The extra 71° line was confirmed to be present electrically.
- The oscilloscope phase experiments were useful for learning the instrument, but high-impedance direct scope termination produced reflected-line behaviour and could not by itself represent loaded array current phase.
Conclusion: the physical coaxial lengths were not the primary cause of the original lack of front-to-back.
6. Initial Problems and Incorrect Assumptions
6.1 Good SWR but little or no front-to-back
An early configuration produced a very attractive shack-end SWR, but the two element impedances were not equal. Representative raw values were approximately 31 Ω for one element and 16–17 Ω for the other at resonance.
This was a 'good SWR, wrong array' condition. A good input match did not mean correct current amplitude and phase.
6.2 Treating the 71° line as a simple phase-delay cable
The 71° section is not an isolated 71° phase shifter. The Christman network uses the complete 84°/155° line pair as impedance and current transformers. The final element current phase depends on element driving impedance, mutual coupling and line transformation.
6.3 Assuming 50 Ω at both element feet would automatically give 50 Ω in the shack
Both elements were matched to 50 Ω + j0 with hairpins and the complete Christman feed was then measured. The result was not 50 Ω at the input. The measured complete-system resistance was only about 14–18 Ω over the relevant range, with SWR around 3.5–3.8. This confirmed that matching each element individually to 50 Ω was not the correct solution for this array.
6.4 Over-reliance on isolated element resonance
The isolated elements were sometimes resonant well above the operating switch frequency. However, the complete Christman system still produced a good SWR dip near 3.790 MHz. This is not contradictory: the 84° lines, 71° line, mutual coupling and switching network transform the total impedance.
7. Mutual-Coupling Measurements
Open/short measurements were used to quantify how strongly one element affected the other. These tests were diagnostic only; an actively driven element in a phased array is neither open nor short. The results nevertheless showed consistent coupling.
8. 50 Ω Hairpin Trial
Both element feet were individually adjusted to approximately 50 Ω + j0 using hairpin matching. The complete Christman system was then measured.

This test proved that 50 Ω at each individual element feed point did not yield a useful 50 Ω system input. It also demonstrated that individual element matching cannot be treated independently from the complete Christman network.
9. 36 Ω Hairpin Trial
Both elements were then adjusted to approximately 36 Ω + j0 at nearly the same frequency. This produced the strongest observed directionality, approximately five S-points front-to-back on a suitable signal.

The price of this strong front-to-back performance was a low complete-array input impedance. The system input was typically around 19–22 Ω in the most useful part of the band, corresponding to SWR near 2.5–2.7.
An external matching network could have transformed this impedance to 50 Ω, but the extra outdoor enclosure, relays, high-current components and weather exposure were considered undesirable contest failure points.
10. Complete 36 Ω Christman Measurement —
The best North/South electrical balance was around the 3.690 and 3.740 switch positions. This configuration also produced the strongest measured front-to-back, approximately five S-points.
11. Search for a Contest-Oriented Compromise
Because the amplifier is an OM Power, reliability and low SWR were prioritised over the final few dB of front-to-back. Rather than add a complex outdoor matching box, the element feed-point impedances were adjusted to find a lower-SWR compromise while keeping both elements equal.
The target was progressively moved from 36 Ω toward approximately 22 Ω. Equality was more important than any single textbook resistance.
12. Final Element Equality Near 21–22 Ω
The two element resonant frequencies were practically identical and the resistance difference was only about 1 Ω. This was the best measured element equality obtained during the campaign.
The final equality was achieved through a combination of hairpin adjustment and very small changes in top-hat tension. Because 1 cm effective movement represents roughly 15 kHz, only very small mechanical changes were required.
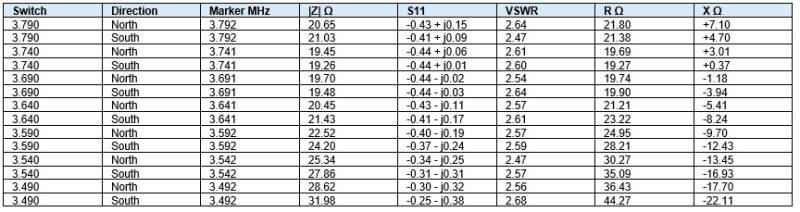
13. Final Shack Measurements on the 3.790 Position

These values are a major practical improvement over the 36 Ω element setting. They are well suited to high-power contest use and require no additional outdoor matching enclosure.
Front-to-back remained audible. A German station showed approximately three S-points difference, although this was not a definitive measurement because Germany was not precisely on the 320°/150° array axis and 80 m propagation may include high-angle components.
14. Interpretation of the Final Result
- The elements are now very closely equal at their feed points.
- The complete Christman network presents approximately 38 Ω in both directions at 3.792, 3.740, 3.690, 3.640, 3.590, 3.540 and 3.490Mhz
- The SWR is approximately 1.3–1.4, suitable for high-power contest operation.
- Useful directionality remains present.
- No extra external L-network or relay box is required.
- The final configuration is a practical reliability compromise, not a pursuit of maximum theoretical F/B at any cost.
15. What Was Learned
- Never use SWR alone to judge a phased array.
- Two elements can produce a beautiful input match while being electrically unequal and giving little front-to-back.
- The 84° and 155° Christman lines transform impedance as well as phase and current.
- Open/short mutual-coupling measurements are diagnostic, but they do not directly equal the active mutual impedance during phased operation.
- Element equality must be checked under the same measurement condition.
- After changing one element, the other element should be re-measured because coupling changes the result.
- Hairpin matching to 50 Ω at each element is not automatically correct for a Christman array.
- Maximum F/B and minimum SWR may occur at different element impedances.
- Wind and top-hat tension can move resonance enough to affect precision measurements.
- For a contest system, fewer outdoor components can be more valuable than the final few dB of theoretical pattern improvement.
16. Correct Procedure for Future Adjustment
- Select one switch position as the primary reference, normally 3.790 MHz.
- Measure North at the element feed point with South open.
- Measure South at the element feed point with North open.
- Adjust only one element at a time.
- Use small top-hat tension changes and allow for wind.
- Bring both elements to nearly identical R, X and resonant frequency.
- Reconnect the complete Christman system.
- Measure the input in both North and South directions.
- Confirm that the two direction impedances are similar.
- Test front-to-back on a stable station close to the 320°/150° axis.
- Do not optimise only the SWR; retain a written record of both SWR and directional performance.
17. Final Conclusion
The 80 m Christman array is a fully self-built system. No commercial phased-array box, pre-cut line set or factory matching solution was used. Every element, top hat, hairpin, coaxial phasing section, switching function and control system was built and adjusted specifically for this installation.
The system was therefore not plug-and-play. It required an extended measurement campaign, an understanding of mutual coupling, repeated correction of wrong assumptions, and disciplined one-change-at-a-time testing.
Create Your Own Website With JouwWeb