Complete-Chain Combiner Measurement Report
VE6WZ / YCCC 9RX Combiner – Bench Test Plan
ON7MV – Miguel Verbanck
Planned indoor measurements of the VE6WZ combiner with onboard common-mode chokes
1. Purpose of This Report
The purpose of this report is to verify the performance of the complete RX9 receiving system after the nine preamplifiers and nine coaxial cables were measured, matched and assigned to their final positions.
The measurements evaluate the full signal path from the antenna input of each preamplifier, through its assigned coaxial cable and combiner input, to the RX output of the combiner. All eight controller directions were tested at 1.8, 3.5, 3.8 and 7.1 MHz.
The report is intended to confirm:
- correct relay routing for every controller direction;
- correct operation of the centre and outer-element signal paths;
- amplitude consistency between opposite element chains;
- correct switched phase delay;
- stability of the centre-channel weighting;
- isolation of inactive combiner inputs;
- the remaining amplitude and phase differences between the complete matched chains.
The main objective is not simply to prove that each individual preamplifier, coaxial cable or combiner input works separately. The objective is to determine whether all matched components also operate correctly when connected together as one complete system.
The measurements therefore provide a system-level verification of the RX9 electronics before installation in the antenna field. They also establish a technical reference that can later be used for troubleshooting, maintenance, component replacement and comparison with future measurements.
In practical terms, the report shows whether the complete RX9 system offers a sufficiently balanced and repeatable electrical basis for accurate directional reception and reliable suppression of signals arriving from unwanted directions.
2. Scope and test configuration
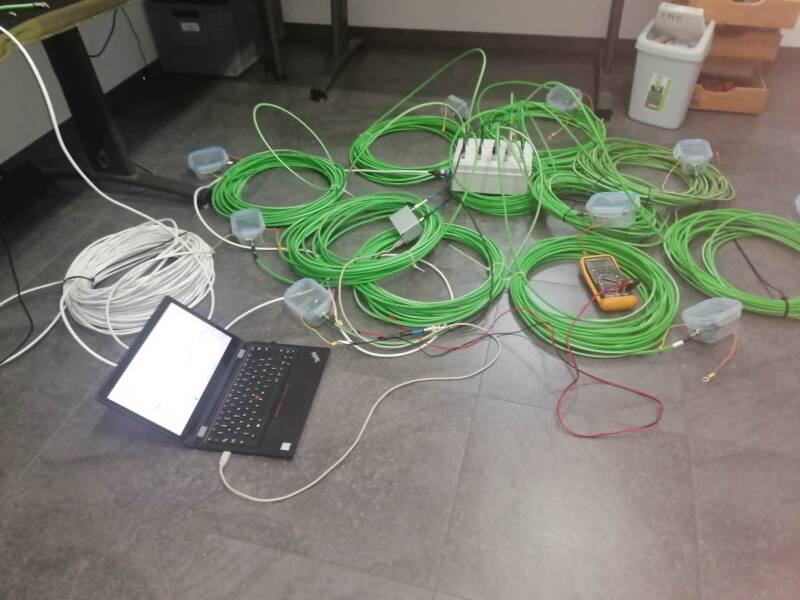
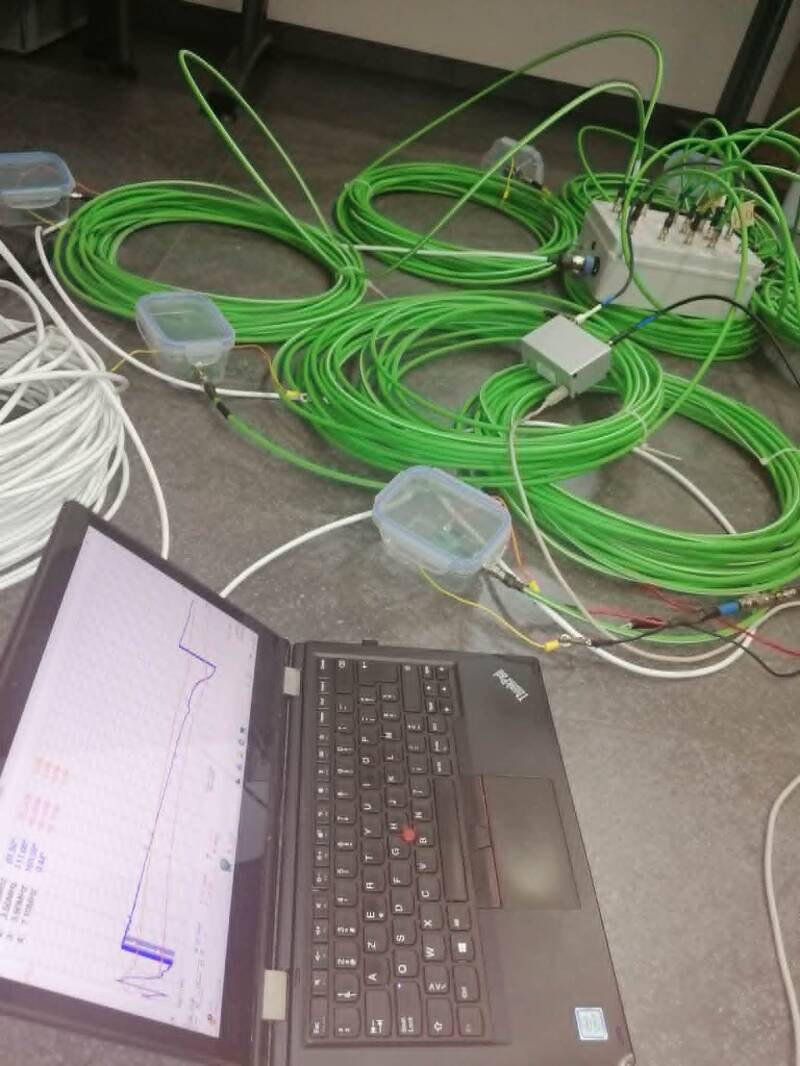
For each chain, the DG8SAQ transmitter was connected to the antenna input of the selected preamplifier. The preamplifier output was connected through its assigned phase-matched coaxial cable to the corresponding RX9 combiner input. The combiner RX OUT was connected to the DG8SAQ receiver input. All nine preamplifiers and all nine coaxial cables remained connected during the tests.
- The same fixed extra input lead was used for every preamplifier and remained outside the calibration plane.
- Every preamplifier/port combination was measured in all eight controller positions.
- S21 phase and S21 magnitude were recorded at 1.800, 3.500, 3.800 and 7.100 MHz.
- A total of 72 screenshots were analysed: 9 chains x 8 controller positions.
- Each screenshot contains four complex S21 readings, giving 288 phase values and 288 magnitude values.
The absolute phase includes every fixed item outside the calibration plane. Relative comparison is valid because the measurement fixture was unchanged throughout the series.
3. Channel assignment and switching logic
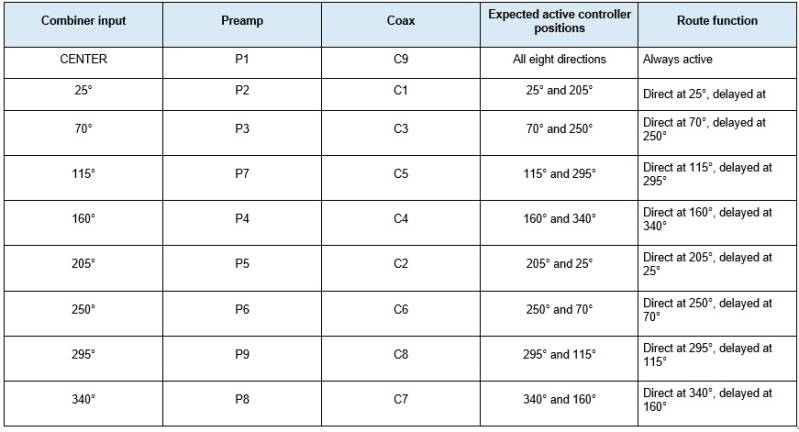
The measurements confirm this routing matrix without exception. No outer input became a high-level active route in an unintended controller position
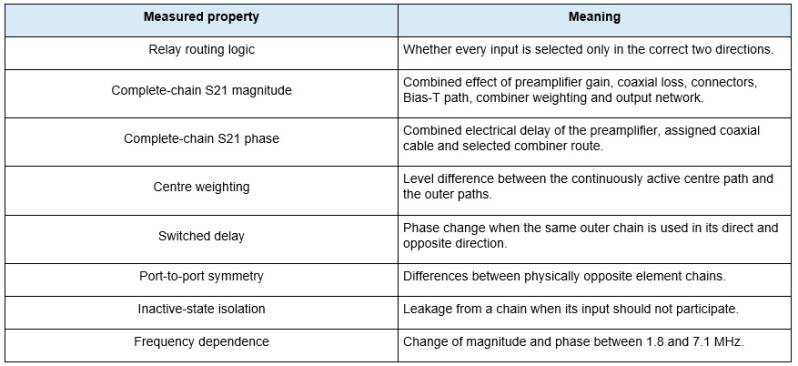
4. What this measurement actually measures
5. Centre path analysis
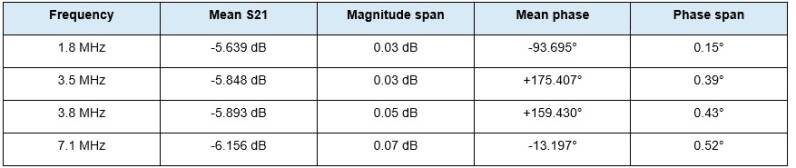
The centre route is exceptionally stable. Changing the selected receive direction barely changes either amplitude or phase. This proves that the centre input remains continuously connected through a common and repeatable path while the outer relay network changes state around it.
The centre S21 decreases from approximately -5.64 dB at 1.8 MHz to -6.16 dB at 7.1 MHz. The outer paths show almost the same frequency slope, so this is a common system response rather than a direction-dependent fault.
6. Outer-path routing and active transfer
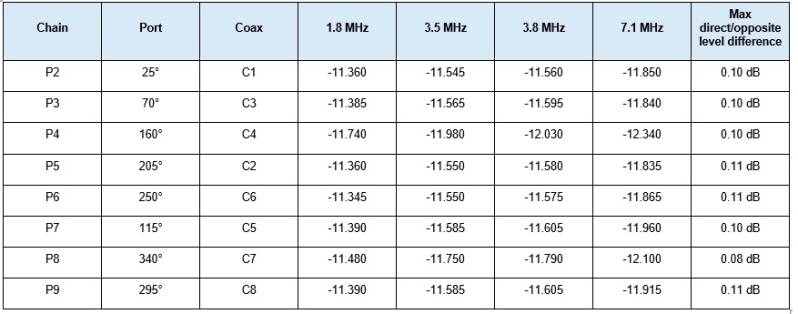
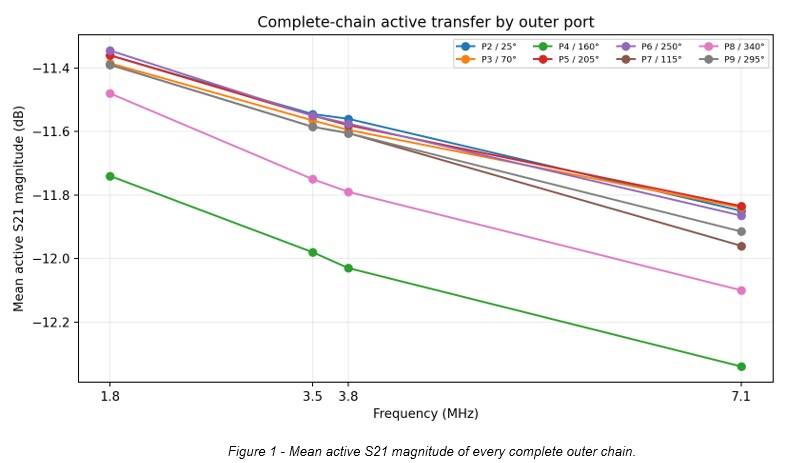
For each individual outer chain, the two valid controller states agree within 0.11 dB at every marker. This is a strong indication that both switch routes of the same input are amplitude-symmetric and repeatable.
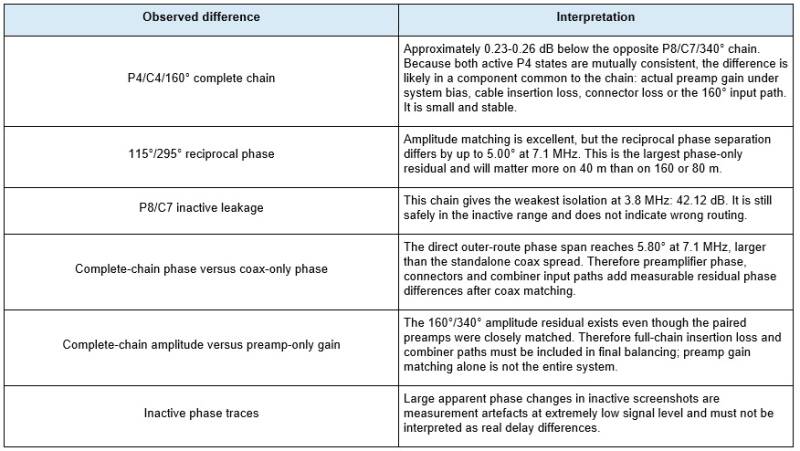
Across all eight outer chains, the mean active transfer spans approximately 0.40 dB at 1.8 MHz, 0.44 dB at 3.5 MHz, 0.47 dB at 3.8 MHz and 0.51 dB at 7.1 MHz. Most of this spread is caused by the 160° chain, which is consistently lower than the other routes.
7. Switched phase delay
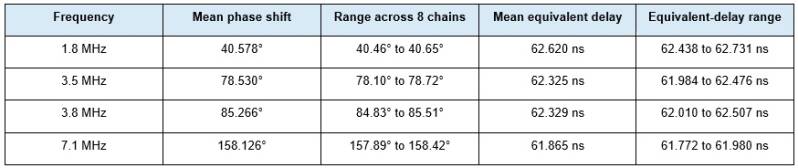
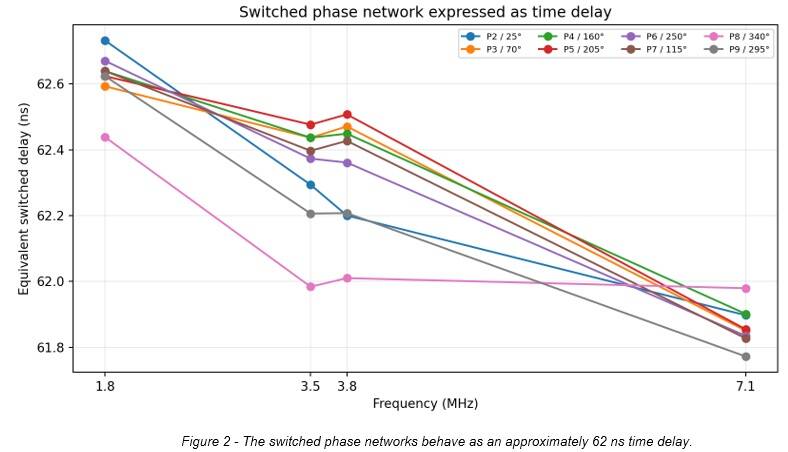
The mean of all 32 delay calculations is 62.285 ns. The complete range is only 61.772 to 62.731 ns. This is an excellent result: all eight inputs see essentially the same additional delay when the opposite direction is selected.
The slightly lower equivalent delay calculated at 7.1 MHz indicates a small amount of normal network dispersion. It is common to all routes and is not evidence of a defective individual relay path.
8. Matched opposite-axis comparison
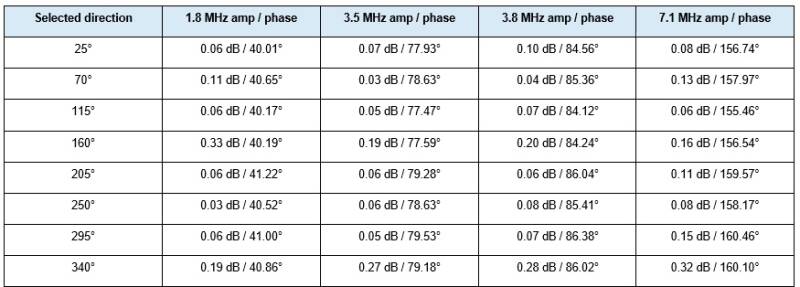
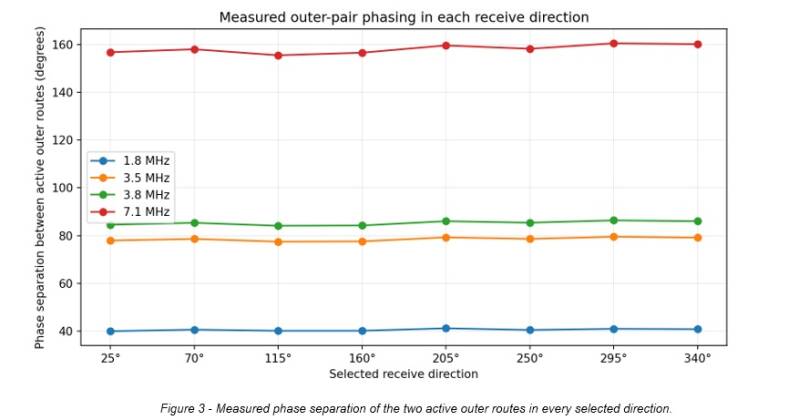
This table is closer to actual array operation than the single-chain delay table: it compares the two different outer element chains that are simultaneously active in each direction. The phase separation therefore includes both the switched delay and the residual phase difference between the two complete physical chains.
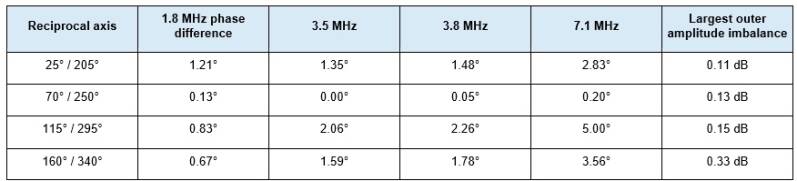
The 70°/250° axis is the most reciprocal. The 115°/295° axis shows the largest phase difference between its two reverse directions, reaching 5.00° at 7.1 MHz, while its amplitude balance remains excellent. The 160°/340° axis shows the largest amplitude imbalance, up to 0.33 dB in the 160° direction and 0.32 dB in the 340° direction.
10. Isolation in inactive controller states
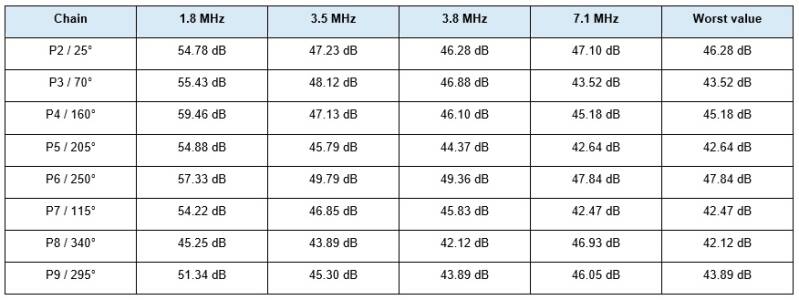
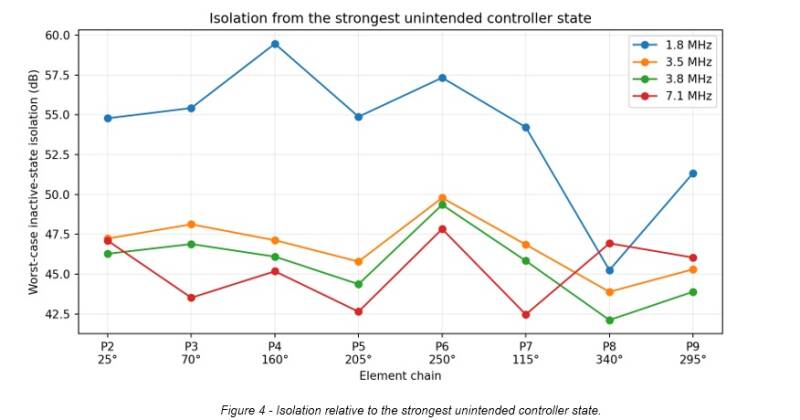
The weakest isolation measured anywhere is 42.12 dB. The frequency-by-frequency minima are 45.25 dB at 1.8 MHz, 43.89 dB at 3.5 MHz, 42.12 dB at 3.8 MHz and 42.47 dB at 7.1 MHz. This is sufficient to confirm correct relay routing and strong rejection of non-selected inputs.
Phase readings in inactive states are not technically meaningful. At -54 to -85 dB S21 the phase trace is dominated by leakage, noise and wrap instability. Only the inactive-state magnitude is used for isolation analysis.
11. Frequency response and centre weighting
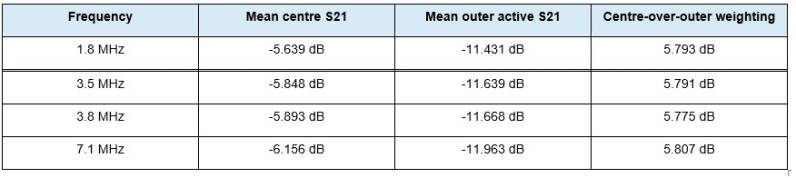
The centre path is 5.78 to 5.81 dB stronger than the average outer path. This weighting is almost perfectly constant over the complete measured frequency range and is one of the strongest results of the test. It confirms that the centre coefficient is stable and not direction dependent.
Both centre and outer routes fall by approximately 0.52-0.53 dB from 1.8 to 7.1 MHz. The common slope indicates the combined frequency response of the preamplifiers, coaxial cables and combiner, not a fault in one selected direction.
12. Main differences and technical interpretation
13. What the measurement proves - and what it cannot separate
13.1 Proven by this test
- The centre path remains active and stable in every controller direction.
- Every outer port is active only in the correct direction and the opposite direction.
- The two switch states of each outer input have extremely similar amplitude.
- The additional switched phase delay is about 62 ns and is consistent on all eight inputs.
- The centre/outer amplitude weighting is approximately 5.8 dB and remains constant with frequency.
- Inactive inputs are isolated by at least 42.12 dB in the measured system.
- The assembled system retains very good matching, while revealing small residual complete-chain differences.
13.2 Not separable from this measurement alone
- The individual contribution of preamplifier gain, coaxial insertion loss, connector loss and combiner input loss.
- The exact phase contribution of the preamplifier versus the coaxial cable versus the combiner route.
- Antenna element mismatch, ground effects, mutual coupling or common-mode current.
- The true on-air radiation pattern, front-to-back ratio, front-to-side ratio or null depth.
- Noise figure, compression, intermodulation behaviour or large-signal immunity.
- Temperature drift and long-term outdoor repeatability.
14. Final assessment and recommendations
- Retain the present component allocation and cable numbering.
- Do not alter coaxial cable lengths on the basis of these results. The complete-chain differences are too small to justify mechanical trimming.
- Document P4/C4/160° as the slightly lower-amplitude chain. Recheck its connectors and insertion loss only if an on-air pattern test shows a corresponding 160°/340° asymmetry.
- Document the 115°/295° phase residual at 7.1 MHz. It is primarily a 40-metre consideration and is much smaller on the priority bands.
- Use the present data as the baseline for future fault finding. Any later change larger than approximately 0.2-0.3 dB or several degrees will be easy to identify.
- The next decisive validation step is not further component matching but an on-air or field-strength pattern test with controlled signal geometry.
The most accurate overall conclusion is that the system is not merely made from individually matched parts: the complete assembled signal paths have now been measured. The matching work successfully removed most amplitude and phase uncertainty, and the remaining differences are small, identifiable and stable.

Create Your Own Website With JouwWeb