RX9 Coaxial Cables – Phase Matching
1. Purpose and background
This report documents the complete calibration, all phase measurements of nine coaxial cables, the independent comparison between the DG8SAQ VNWA V2 and the Rohde & Schwarz FSH8, the statistical analysis, fitted electrical delay, exhaustive matching of every technically unique allocation and the practical consequences for the RX9 array.
The central question is not whether the two instruments display exactly the same absolute phase. Different reference planes, internal delays, adapters and marker frequencies may create a fixed offset. The relevant question is whether both instruments independently confirm the same cable-to-cable differences, spread and ranking.
2. Test equipment
DG8SAQ VNWA V2 used as a stable RF signal source.
Calibrated RTC1002 digital oscilloscope.
Calibrated Rohde & Schwarz FSH8
Calibrated Fluke multimeter for supply-voltage verification.
Bias-T used for simultaneous RF extraction and DC supply.
Identical coaxial cables and connections for all nine preamplifiers.
Nine VE6WZ/YCCC element preamplifiers from the same 9RX array.
3. Device under test and array logic
The RX9 array uses one centre channel and eight outer channels. Each receive direction uses an active three-element group: the centre and one diametrically opposite outer pair. Two quantities therefore matter: the total spread of all nine cables and the phase spread within each of the four active centre-plus-pair combinations.
- Centre cable: one cable participating in all eight directions.
- Four outer pairs: each axis provides two opposite receive directions.
- Matching objective: minimise the worst active three-cable group, prioritising 160 and 80 metres.
4. Instruments and calibration

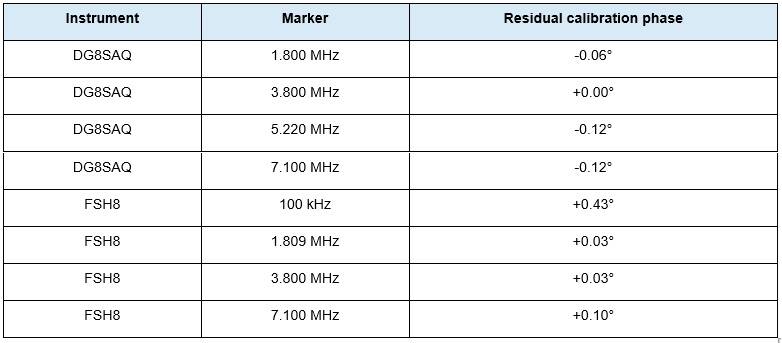
Both calibrations are effectively at 0° across the relevant bands. The residual calibration errors are much smaller than even the small cable-to-cable differences. Because every cable in a series was measured with the same calibration, a fixed residual error does not change the relative spread.
5. Measurement method
- Calibrate the transmission-phase measurement with the actual test leads and connectors at the reference plane.
- After calibration, leave adapters, test leads, sweep settings and marker settings unchanged.
- Insert cables 1 through 9 sequentially in the identical measurement fixture.
- Read the four phase values for every cable and save a screenshot.
- Repeat the complete series independently with the second instrument.
- First compare spread within each instrument, then compare the two instruments.
- Use 160, 80 and 40 metres for direct cross-instrument comparison; do not compare the 5 MHz markers absolutely because they are at 5.080 and 5.226 MHz.
6. Raw DG8SAQ results
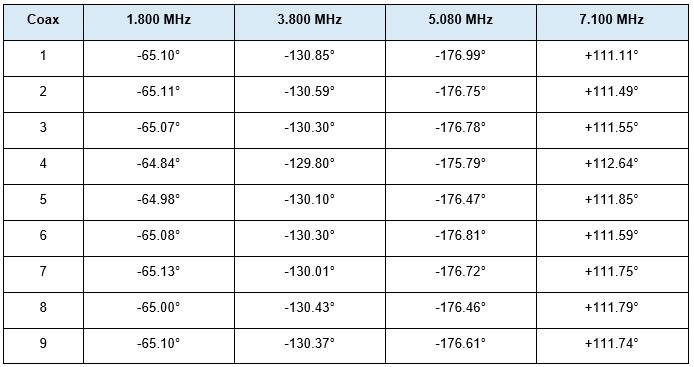
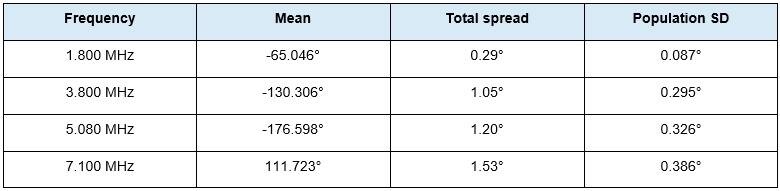
The DG8SAQ series shows exceptionally small spread: 0.29° on 160 metres, 1.05° on 80 metres and 1.53° on 40 metres. Cable 4 is clearly the electrically shortest; cable 1 is generally the longest.
7. Raw FSH8 results
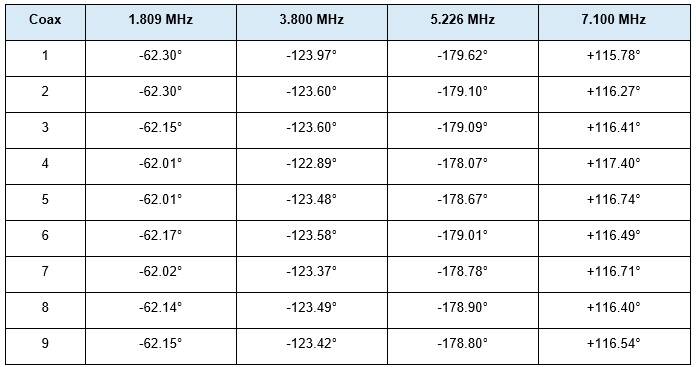
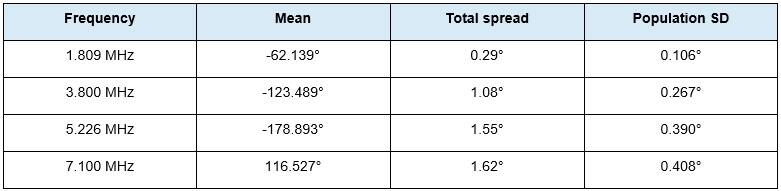
The FSH8 independently confirms almost the same result: 0.29° on 160 metres, 1.08° on 80 metres and 1.62° on 40 metres. This instrument also identifies cable 4 as the shortest and cable 1 as the longest.
8. Statistical comparison
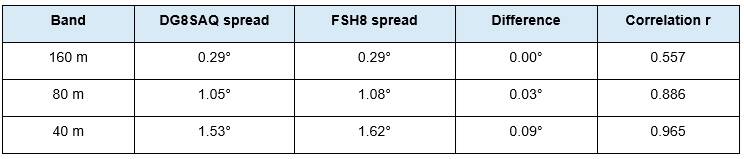
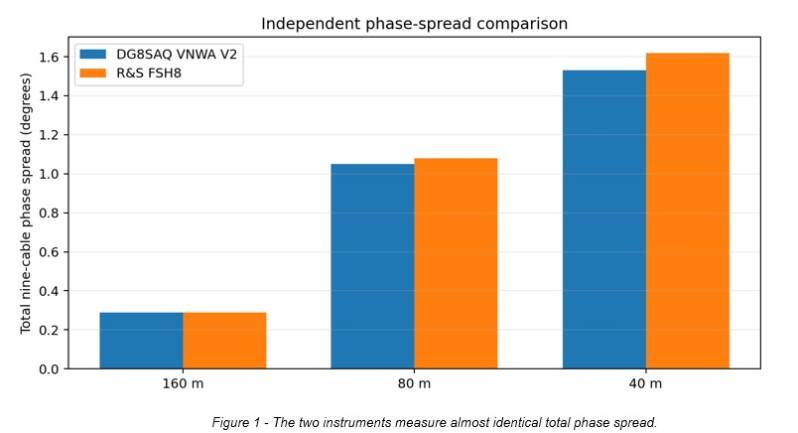
Cable-to-cable agreement is strong to very strong on 80 and 40 metres. Correlation is lower on 160 metres because the entire spread is only 0.29°, close to practical reading and repeatability limits. The fact that both instruments nevertheless find exactly the same total spread remains convincing.
9. Absolute offset versus relative spread
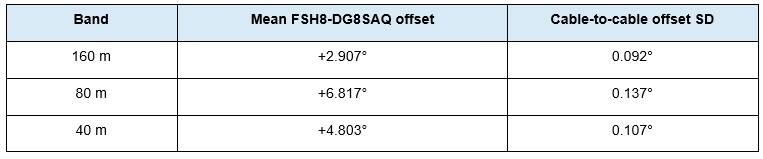
The FSH8 readings are on average about 2.91° higher near 1.8 MHz, 6.82° higher at 3.8 MHz and 4.80° higher at 7.1 MHz. These offsets do not prove that either instrument is wrong. They include differences in marker frequency, reference plane, internal group delay, adapters and phase processing.
For matching, cable-to-cable deviation within the same instrument is decisive. The small standard deviation of the instrument offset shows that the offset is largely common and reproducible.
10. Electrical delay and ranking
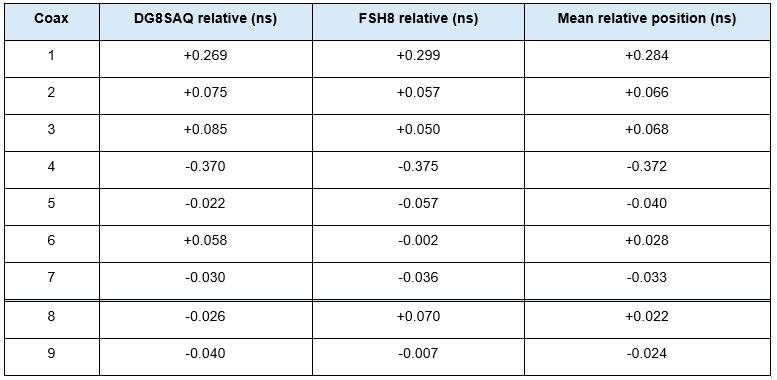
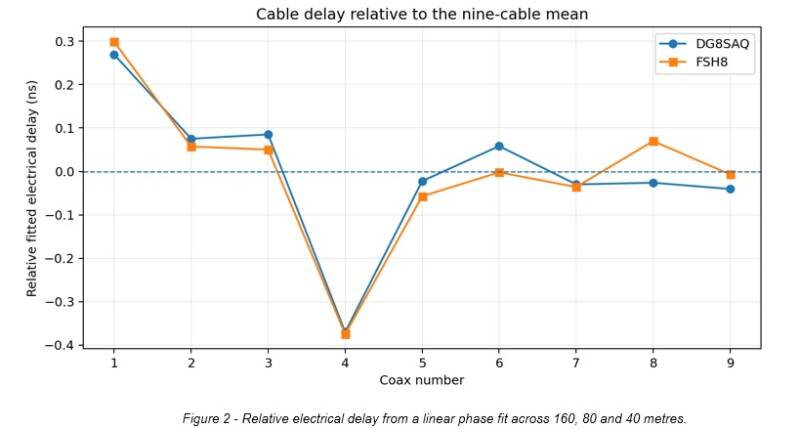
The combined relative fitted-delay span is approximately 0.657 ns. Cable 4 is about 0.37 ns shorter than the mean; cable 1 is about 0.28 ns longer. Absolute fitted delays differ between instruments because of their reference planes and are therefore not treated as a cable specification.
11. Exhaustive matching of 945 layouts
There are nine choices for the centre cable. The remaining eight cables can be divided into four unlabeled pairs in 105 unique ways: 8! / (2^4 x 4!) = 105. Therefore 9 x 105 = 945 technically unique centre-plus-pair layouts were evaluated.
For every layout, the phase spread within all four active three-cable groups was calculated for each instrument and band. Selection was lexicographic: first the smallest worst group spread on the priority bands of 160 and 80 metres; then the smallest sum on those bands; finally performance including 40 metres.
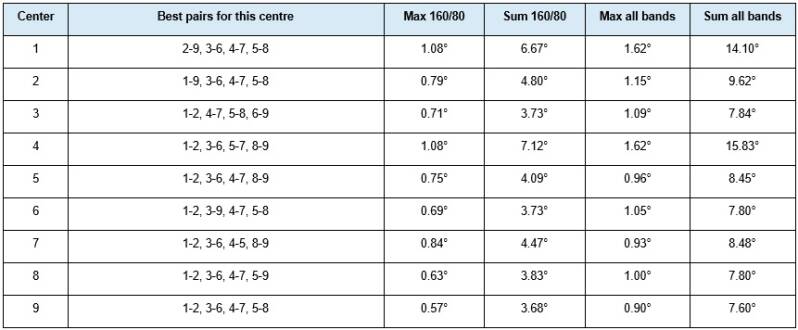
Cable 9 is the only centre choice that reaches the global optimum score. This is because cable 9 lies very close to the mean of the complete set on both instruments while the remaining eight cables can simultaneously be divided into favourable pairs.
12. Final centre cable and pairs
CENTRE CABLE: 9
OPPOSITE PAIRS: 1-2, 3-6, 4-7 and 5-8
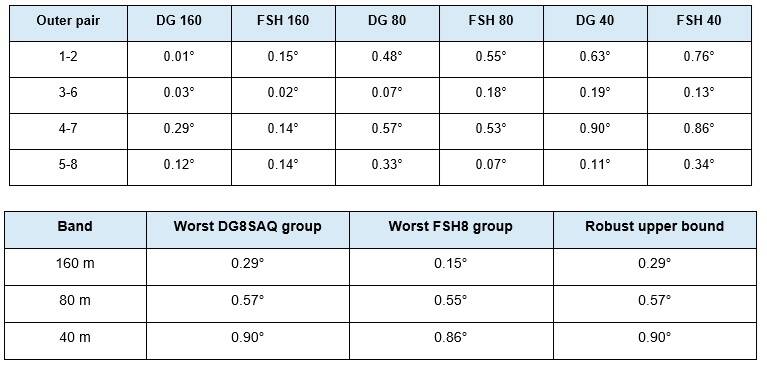
Pairs 1-2 and 3-6 emerge naturally on both instruments. Pair 4-7 accommodates the electrically shortest cable 4 with a cable on the short/middle side without pairing it with the longest cable 1. Pair 5-8 forms the remaining stable combination. The result is the best combined allocation for the priority bands, not necessarily the absolute minimum at every individual frequency.
13. Benefit compared with random allocation
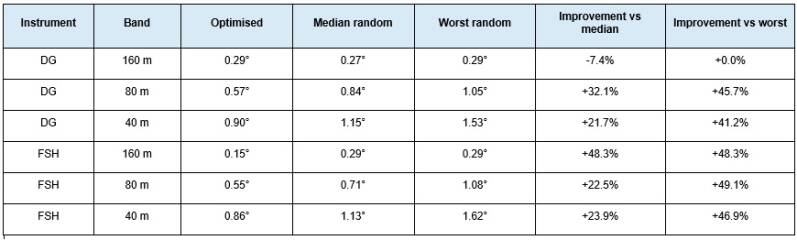
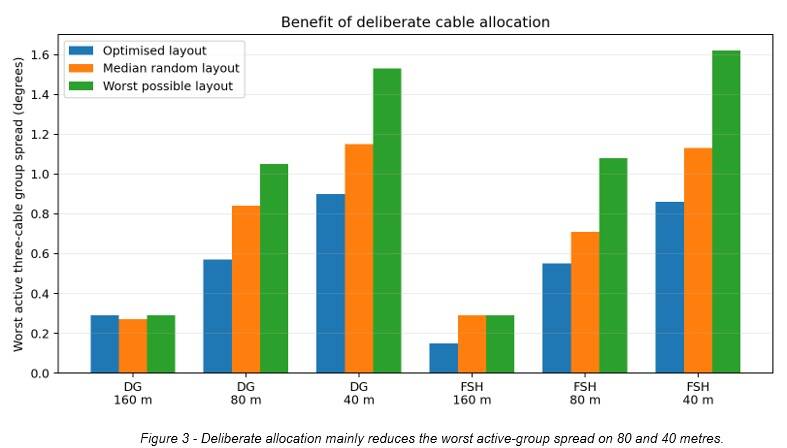
On 80 metres, the worst group spread falls from a median random value of about 0.84° to 0.57° in the DG8SAQ data and from 0.71° to 0.55° in the FSH8 data. On 40 metres it falls from about 1.15° to 0.90° and from 1.13° to 0.86°. Compared with the worst possible allocation, the reduction is approximately 41-49% on 80 and 40 metres.
On 160 metres all differences are so small that the choice will hardly be visible in practice. Matching there is mainly for reproducibility and consistency, not because a random allocation would be unusable.
14. Practical effect on summing and nulls

For constructive summing, the effect is negligible. Even a 0.90° phase error causes less than 0.0003 dB loss in a simple two-path comparison. Therefore cable allocation alone does not produce a noticeable S-meter increase or forward-gain improvement.
Nulls are more sensitive. If two perfectly equal signals fail to cancel only because of phase error, 0.55-0.57° corresponds to an illustrative limit near 46 dB and 0.86-0.90° to about 42 dB. This is not a prediction of actual RX9 rejection: the real array uses three elements, amplitude weighting and fixed delays and is also limited by element tolerances, preamplifiers, relays, soil, coupling and local noise. The calculation merely demonstrates why a small phase error matters more for deep rejection than for forward summing.
15. Is deliberate matching worthwhile?
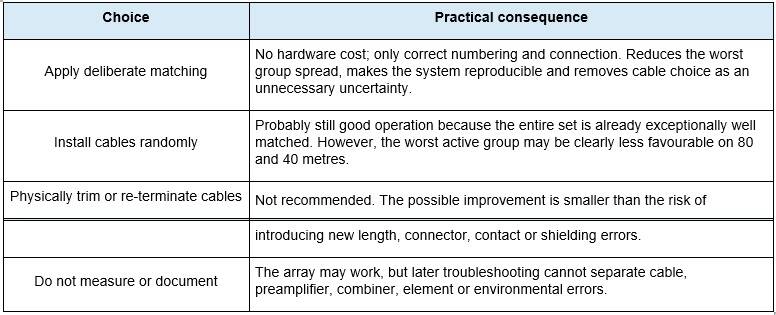
Decision: deliberate allocation is worthwhile because it is free and risk-free once the cables are numbered. Mechanical modification is not worthwhile because the existing spread is already far too small to justify it.
16. Limitations
- The 160-metre markers are not identical: 1.800 MHz on the DG8SAQ and 1.809 MHz on the FSH8. This explains a small part of the absolute offset but has little effect on relative ranking.
- Fitted delay is derived from only three common bands and is intended as a relative electrical ranking, not a calibrated absolute cable propagation time.
- Insertion loss, return loss, intermittent connector behaviour and temperature coefficient were not investigated in this specific phase series.
- The theoretical null calculations are illustrative two-path limits and not an NEC or system model of the complete RX9.
- Final array performance also requires correct preamplifier gain, element geometry, combiner phasing, relay operation, soil conditions and common-mode control.
17. Final conclusion
The two independent instruments confirm the same technical reality: the nine coaxial cables are exceptionally well matched in electrical length. Measured total spread is identical on 160 metres and differs by only 0.03° on 80 metres and 0.09° on 40 metres. The agreement is too close to be explained as a coincidental instrument error.
An exhaustive assessment of all 945 technically unique centre-plus-pair layouts selects cable 9 as centre and pairs 1-2, 3-6, 4-7 and 5-8. This allocation is the most robust on the priority bands of 160 and 80 metres and keeps the worst group spread below approximately 0.9° on 40 metres.
FINAL ASSESSMENT: all nine cables are approved. Number them, install them according to the recommended allocation and do not alter their physical length.
Create Your Own Website With JouwWeb