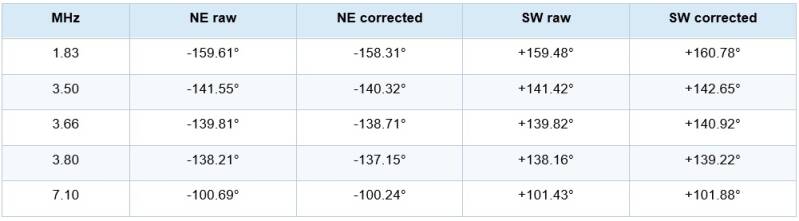
Direct YCCC combiner verification
The direct test removed the preamplifiers and long element cables from the phase comparison. The centre-to-RX route became the reference, after which the NE and SW paths were measured separately. This is the measurement prescribed by the YCCC manual and is the final authority for the combiner phase network.
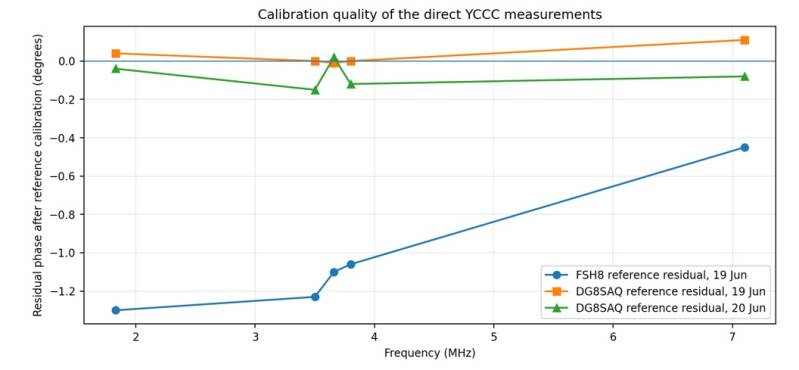
FSH8 phase test - 19 June 2026
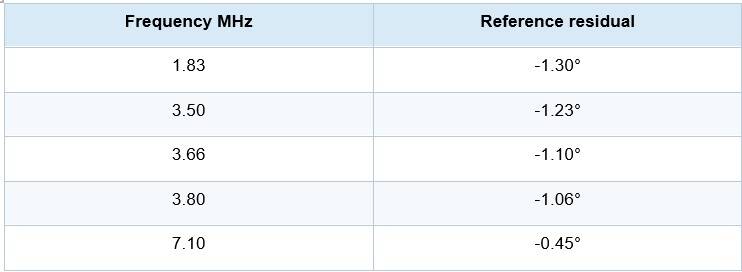
The FSH8 reference retained a smooth residual from -1.30° at 1.83 MHz to -0.45° at 7.1 MHz. This is not a problem because the residual was measured and subtracted. It does mean that raw FSH8 phase values must not be compared directly with the near-zero DG8SAQ reference without correction.
DG8SAQ phase-only repeat - 19 June 2026
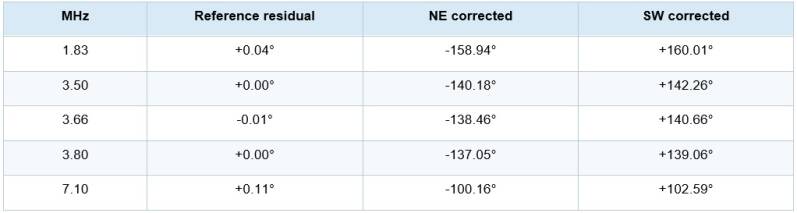
The DG8SAQ reference was essentially flat, with a maximum absolute residual of only 0.11°. This series independently confirmed the FSH8 result and established that the direct measurement was repeatable before magnitude was added on the following day.
Final DG8SAQ phase and magnitude test - 20 June 2026
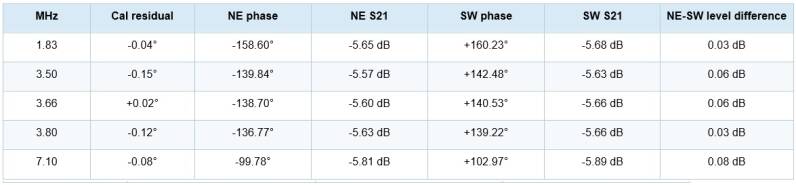
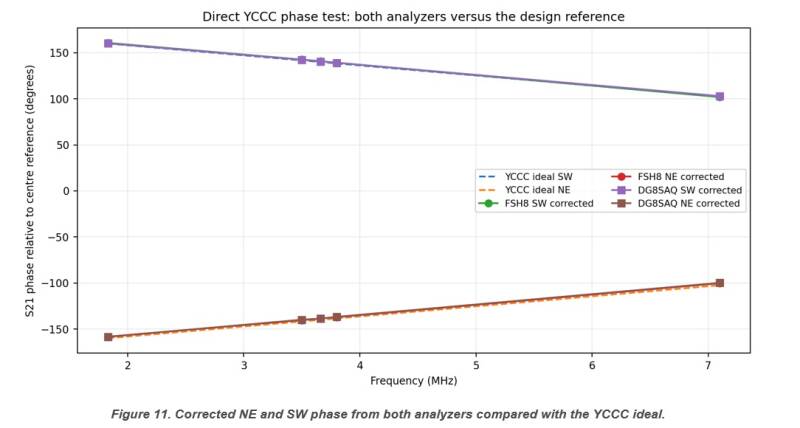
Compliance at the official YCCC markers
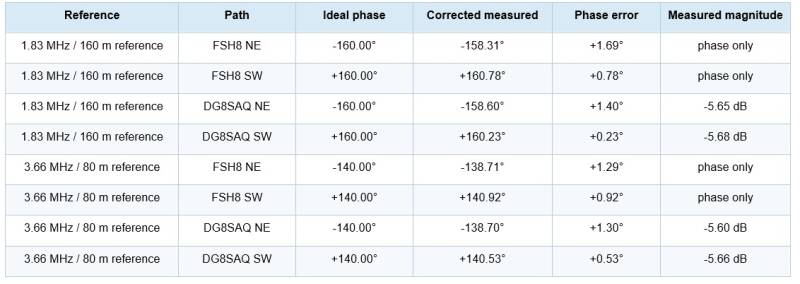
The positive/SW path is very close to ideal. The negative/NE path is systematically about 1.3-1.9° less negative on the primary markers. Both analyzers show the same asymmetry, which means it belongs to the combiner network or fixture rather than one analyzer. The pair midpoint remains only about one degree from the centre reference, and the differential delay remains correct.
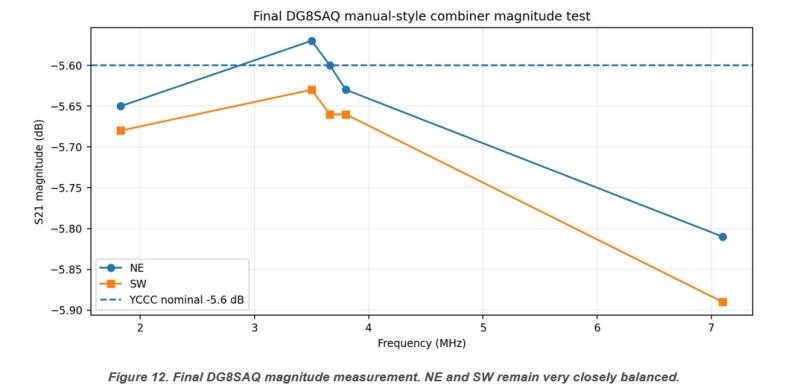
Direct magnitude assessment
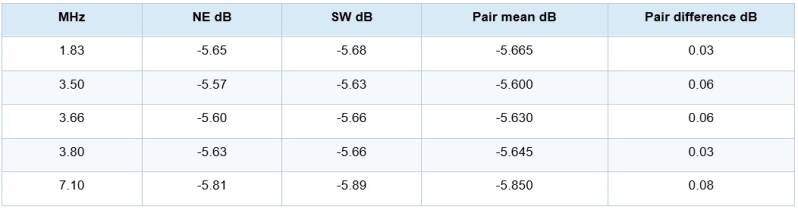
From 1.83 through 3.80 MHz the pair mean is -5.60 to -5.665 dB, extremely close to the YCCC nominal -5.6 dB. The NE/SW imbalance is only 0.03-0.06 dB in this range and 0.08 dB at 7.1 MHz. At 7.1 MHz both paths have slightly more insertion loss, but remain closely matched. The formal phase-and-magnitude combiner test is therefore complete.
Cross-analyzer comparison and repeatability
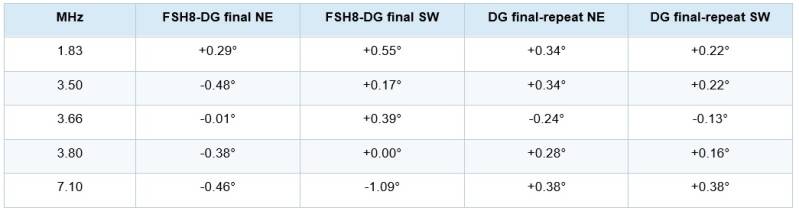
After correction of each reference trace, the RMS FSH8-versus-final-DG8SAQ phase difference is 0.48° and the maximum single difference is 1.09°. The two DG8SAQ measurements, performed on different days and with the final magnitude trace enabled in the second series, repeat within 0.38°. This is excellent agreement for a field-built low-frequency phasing network with reconnections between series.
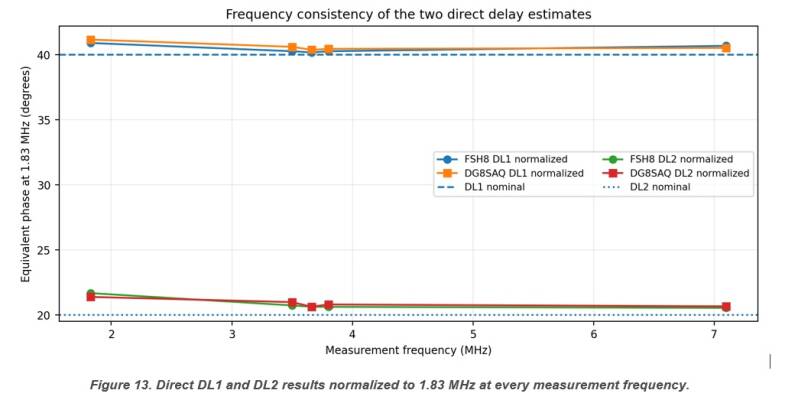
Final delay-line analysis DL1 - differential 40° delay
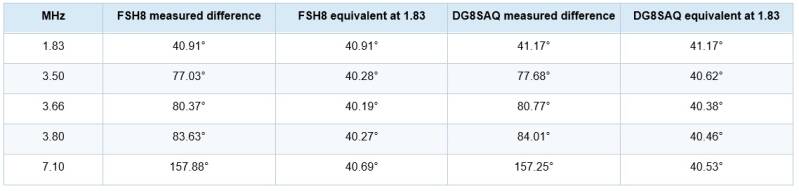
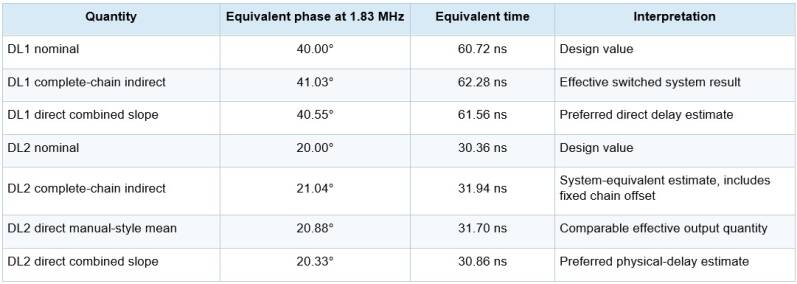
The simple normalized averages are 40.47° for the FSH8 and 40.63° for the final DG8SAQ series. A fit that separates a constant intercept from the frequency-dependent delay gives 40.74° and 40.37° respectively. The combined slope estimate is 40.55° at 1.83 MHz, equivalent to 61.56 ns.
Final delay-line analysis DL2 - differential 20° delay
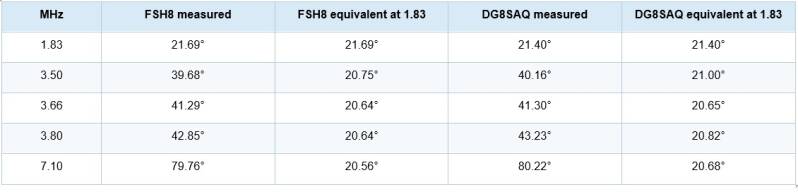
The manual-style normalized averages are 20.86° and 20.91°. These include the approximately one-degree fixed midpoint offset visible in the direct outputs. The slope-only estimates are 20.22° and 20.44°. Their combined slope estimate, 20.33° at 1.83 MHz or 30.86 ns, is the preferred estimate of the frequency-dependent delay itself.
Nominal, indirect and direct results
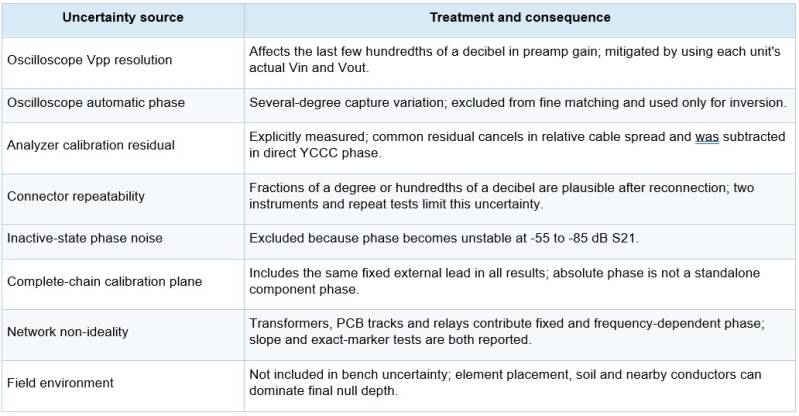
Measurement uncertainty and error
Practical meaning for the real array
The matching does not make a wanted signal audibly stronger. The full preamplifier spread of 0.308 dB is only about 3.61% in voltage and approximately 0.05 S-unit at 6 dB per S-unit. Cable phase errors below one degree within an active matched group also create essentially no forward-summing loss. The benefit appears where the array tries to cancel an unwanted signal.
- Opposite directions begin from closely matched electronic channels instead of arbitrary strong/weak and long/short combinations.
- The measured pattern should be more symmetrical and repeatable when switching direction.
- Deep nulls are less likely to be limited prematurely by avoidable cable or preamplifier mismatch.
- Troubleshooting is greatly improved because every component has a measured baseline and permanent assignment.
- Future degradation can be localized by repeating only the affected standalone or complete-chain measurement.
The bench result also establishes realistic expectations. The remaining complete-chain spread, especially the 0.23-0.26 dB 160°/340° difference and the larger 40-metre phase residuals, demonstrates that matching individual parts cannot make the assembled system mathematically perfect. The final field pattern will also be limited by the antennas and environment.
Create Your Own Website With JouwWeb